Cluster Compare#
ClusterCompare is an algorithm for cluster comparison, taking into account presence of biosynthetic profiles, NRPS/PKS module counts and layouts, and gene functions, along with the sequence identity and synteny used by the clusterblast module.
The range of scores for any pairing is between 0 and 1, with 1 being a theoretical perfect score. When comparing multiple protoclusters against a single region, the score may be higher and mousing over each protocluster's result will show the 0-1 score for that particular protocluster, along with the breakdown of the individual metrics that combined to that score.
ClusterCompare comes with a pre-built comparison data set for the MIBiG database (enabled with --cc-mibig).
Custom databases can also be created and used, see below for details.
Analysis modes#
There are two sets of options for analysis covering both analysis type and scoring direction.
For scope, the choices allow for increasingly fine-grained comparisons:
- Region to Region: the simplest approach, which compares the entire query region to the entire reference region
- Protocluster to Region: compares each protocluster (including neighbourhood) in the query region to the entire reference region
- Protocluster to Protocluster: compares each protocluster in the query region to each protocluster in the reference region
Multiple of these scope modes can be enabled in the configuration file for a particular database (see "Custom databases" below). In the case of the default MIBiG comparison, both "Region to Region" and "Protocluster to Region" are enabled.
For direction, there are two choices:
- Reference in Query ("RiQ"): for when the desired outcome is annotating regions in the input sequence that fully contain the reference
- Query in Reference ("QiR"): for when the desired outcome is annotating regions that contain components of a larger reference
In the case of the default MIBiG comparison, "Reference in Query" mode is used.
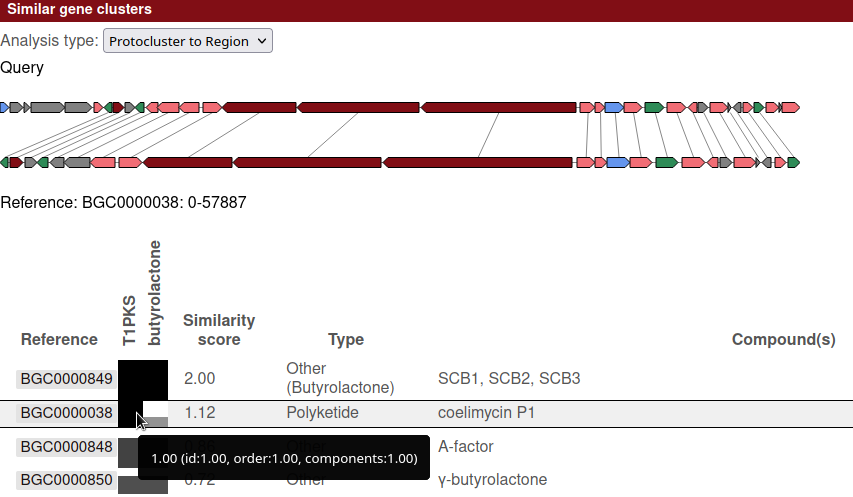
Example results#
The following example is from Streptomyces Coelicolor, comparing against the MIBiG database.
At the top of the section is a drop down with the analysis types available, in this case showing "Protocluster to Region". If other analysis types were enabled for that database, the results for that other type can be selected here.
Below the analysis type is a visualisation of the query region and the currently selected reference region. Lines between the two regions connect genes with the best 1:1 match.
At the bottom of the section is a table showing the details of each hit. The currently selected region is shown by the black border box on the row. Clicking another row will select that reference region and update the visualisation to match.
While in "Protocluster to Region" mode, there is a column for each protocluster in the query region.
Each of those columns is labelled with the protocluster type, and each matching cell indicates how well that particular protocluster contains the reference.
In the example below, the currently selected row shows that the selected reference region (BGC0000038: "coelimycin P1")
is fully contained within the T1PKS protocluster, but not the butyrolactone protocluster.
On the other hand, the hit above that (BGC0000849: "SCB1, SCB2, SCB3") is contained by both protoclusters,
which, in this case, is unsurprising given that the butyrolactone protocluster is itself contained by the T1PKS cluster.
Mousing over a cell in the comparison columns, as shown in the example, will display details on the metrics used to determine the score. Each metric also has a range of 0 to 1, with the final score for a cell being the geometric average of the metrics.
Custom databases#
The following instructions refer to scripts and files available within the
antismash/modules/cluster_compare/data
directory within the antiSMASH source.
The antiSMASH source comes with a script (build_cluster_compare.py)
to easily generate custom databases, which can then be used in further analyses with --cc-custom.
The script expects, as input, a single directory containing multiple antiSMASH output directories. These results will form the database.
After running the tool, a final step will be to create a JSON configuration file for the custom database.
The schema for this file is defined in schema.json, complete with descriptions for each field.
For an example, see the mibig.json configuration file, which defines the configuration for the MIBiG comparison.