ClusterBlast#
There are three modes of the ClusterBlast alogorithm, all of which use the same algorithm and results visualisation, varying only in reference dataset:
- ClusterBlast: shows regions from the antiSMASH Database that are similar to the current region
- KnownClusterBlast: shows clusters from MIBiG that are similar to the current region
- SubClusterBlast: shows sub-cluster units related to the current region
Interpreting results#
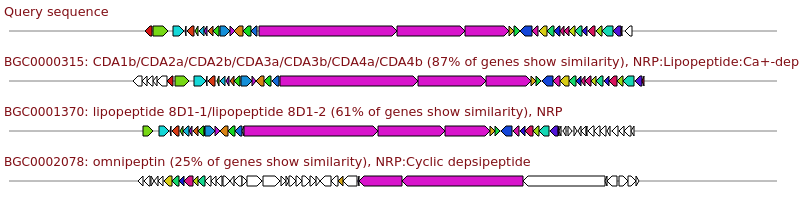
Genes with matching colours are interrelated. Percentage identity values per hit are shown when clicking the gene in question, with a minimum percentage identity between genes of 45%.
It is normal to have multiple genes hitting for some types of genes (e.g. modular systems such as NRPS or Type I PKS clusters).
As gene hits are not required to be 100% identity and query genes may hit multiple reference genes, all genes having a match is not a guarantee that the region is exactly the same. In the case of KnownClusterBlast, this also means that there is no guarantee that the compound(s) recorded for that MIBiG entry will be produced by the region.
Even if 100% of genes have a hit for a reference, it may be less relevant than a lower similarity. Some cluster types, e.g. NRPS clusters, may only need a few aminos changed in gene translations to have a completely different product.
In all cases, manual verification is required before assuming that the region produces the same compound as the reference.
Ranking system#
Reference areas are sorted based on an empirical similarity score and then, in the case of any ties, cumulative blast score.
The emprical similarity score is calculated as h + H + s + S + B, in which:
his the number of query genes with a significant hitHis the number of core query genes with a significant hitsis the number of gene pairs with conserved syntenySis the number of gene pairs with conserved synteny involving a core geneBis a core gene bonus
If the similarity scores are equal for multiple references, they are then ranked based on the cumulative BlastP bit scores of those references.
Example 1: not all genes, but good match#
Reference area R has 70% of genes showing similarity to the query region Q.
All genes with hits are very high identity in their hits, at 95% or higher.
The missing genes from R are all at one end of the reference area.
These genes are also present in the genome antiSMASH was run on,
but are outside Q due to the size of R being exceptionally large.
After manually checking these extra genes and seeing that they're similar to the missing genes, it's much, much more likely that the genome matches the reference.
Example 2: all genes, but poor match#
Reference area R has 100% of genes showing similarity to the query region Q.
None of the genes have a percentage identity in individual hits greater than 60%.
While it is still possible that Q produces the same compound as R,
it will depend a great deal on the type of cluster and exactly which parts of the genes are similar.
Example 3: most genes, but poor match#
Reference area R has very high (but not 100%) similarity, with all but one gene in R having similarity to genes in the query region Q.
All of the matching genes have very high identity in their hits.
The gene in R that is missing in Q should be in the middle of Q and is a core gene responsible for the scaffold of the compound.
While it is still possible that Q produces the same compound as R, due to the functionality being present elsewhere, but it is much less likely.